Architecture 101: Top 10 Non-Functional Requirements (NFRs) you Should be Aware of
Non-functional requirements play an integral role in designing distributed, cloud-native architectures. Teams should know how the new features or modifications to an existing feature would impact the NFRs. This enables teams to deliver more robust products. Let’s delve into the topic by understanding what a Non-functional requirement (NFR) is.
What is a Non-functional Requirement?
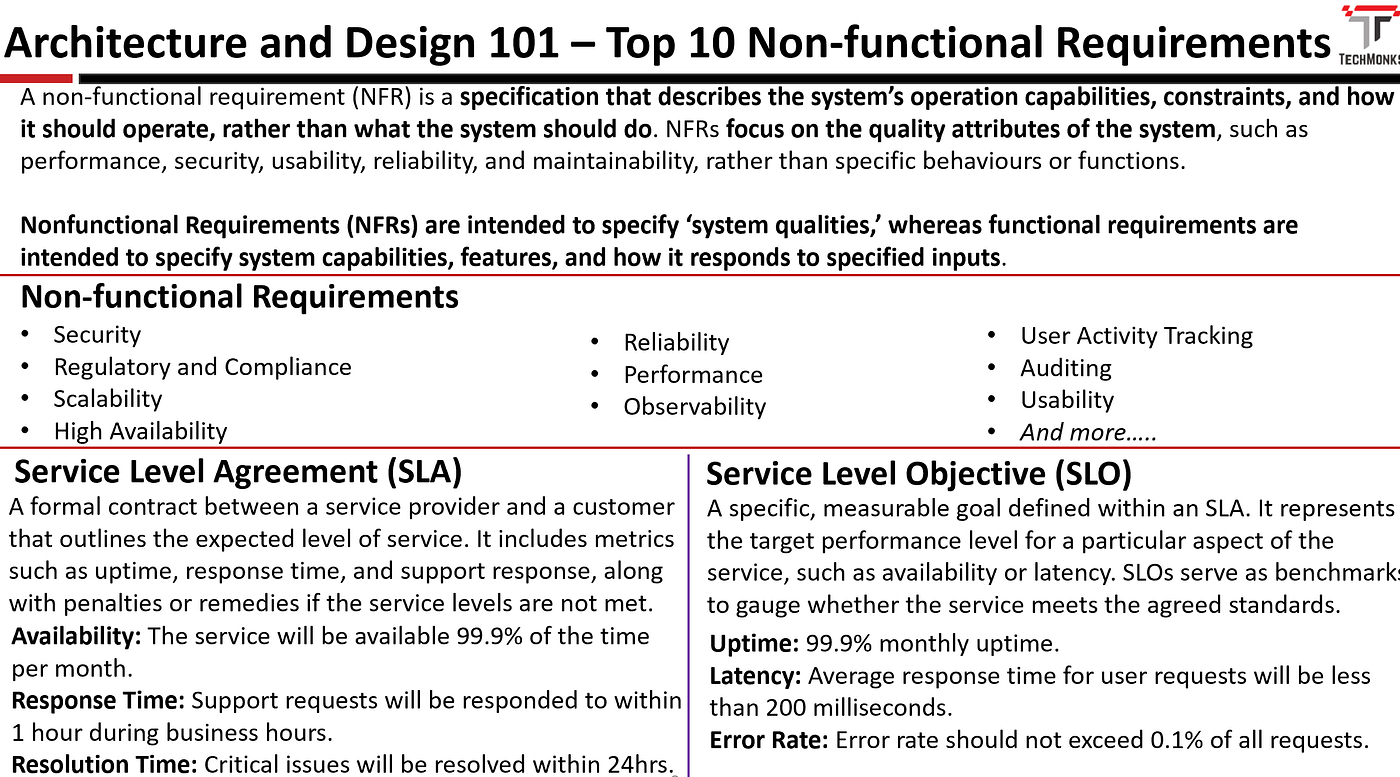
A non-functional requirement (NFR) is a specification that describes the system’s operation capabilities, constraints, and how it should operate, rather than what the system should do. These requirements focus on the quality attributes of the system, such as performance, security, usability, reliability, and maintainability, rather than specific behaviors or functions.
To be precise, Nonfunctional Requirements (NFRs) are intended to specify ‘system qualities,’ whereas functional requirements are intended to specify system capabilities, features, and how it responds to specified inputs.
Examples of NFRs
- The customer search should respond within 500 milliseconds.
- The system must be able to handle 10,000 transactions per minute.
- The system must achieve 99.95% uptime.
- The system must be able to continue operation without data loss in the event of a single server failure.
Top 10 Non-Functional Requirements (NFRs)
- Security
- Regulatory and Compliance
- Scalability
- High Availability
- Reliability
- Performance
- Observability
- User Activity Tracking
- Auditing
- Usability
Security
Security is critical in defining the qualities and constraints that ensure a system’s robustness against threats and vulnerabilities. Security is a broader aspect and covers various parts of the entire ecosystem.
Key Focused Areas
- Identify and Access Management — Implementing strong Authentication and Authorization.
- Network Security — Network Segmentation, IP Allow/deny lists, and Secure communication across the ecosystem.
- Application Security — Secure Coding Practices, Vulnerability Management, and Secure SDLC practices including code reviews, static and dynamic analysis, and security testing.
- Data Security — Data Classification and Handling, encryption, masking, hashing, and Data Loss Prevention methodologies.
Key Metrics
- Security Incident Metrics
- Number of security incidents along with response time.
- Incident detection times along with resolution rate. - Access and Authentication Metrics
- Failed Login Attempts
- Unauthorized Access Attempts
- Account Lockouts
- MFA (Multi-factor-authentication) adoption rate - Data Security Metrics
- Data Breaches
- Data Loss Incidents
- Data Access Violation Incidents
- Data at rest and transit coverage
- Data encryption coverage - Network Security Metrics
- Firewall rule violations
- Network Traffic Anomalies
- Intrusion Detection/Prevention System (IDS/IPS) Alerts - Vulnerability Metrics
- Number of vulnerabilities along with severity levels and resolution rate.
- Time to patch and patch completion rate. - Security Operations Metrics
- Security Monitoring Coverage
- False Positive/Negative Rates
- Security Tool Utilization
Regulatory and Compliance
Regulatory and compliance requirements ensure that the system operates within the boundaries set by laws and regulations, thereby avoiding legal penalties and building trust with stakeholders. Regulatory and compliance aspects are critical for ensuring that a system adheres to the necessary legal, regulatory, and industry standards.
Key Focused Areas
- Legal and Regulatory Requirements — Identify and integrate specific legal and regulatory requirements applicable to the industry (e.g., GDPR, HIPAA, PCI-DSS).
- Compliance Audits: Conduct internal and external audits to ensure adherence to regulatory standards.
- Certification and Accreditation: Obtain necessary certifications (e.g., ISO/IEC, etc.) to demonstrate compliance.
- Security Policies: Develop and enforce comprehensive security policies covering all aspects of data protection and compliance.
- Data Retention Policies: Establish clear guidelines for data retention and disposal in line with regulatory requirements.
- Audit Trails: Maintain comprehensive logs of system activities, including data access and modifications.
- Continuous Monitoring: Implement systems for continuous monitoring of compliance, and security status along with reporting capabilities.
- Legal Compliance: Stay informed about changes in laws and regulations and adjust compliance strategies accordingly.
Key Metrics
- Compliance Metrics
- Compliance Status with relevant regulations (GDPR, HIPAA, PCI-DSS etc).
- Number and severity of internal/external Audit Findings
- Number of Policy Violations instances
- Regulatory and Compliance Training and Effectiveness Metrics. - Risk Management Metrics
- Risk Assessment Frequency.
- Identified Risks during assessments.
- Risk Mitigation metrics. - Data Protection Metrics
- Number of Data Subject Access Requests (DSARs) received and processed.
- Access Control Effectiveness - Audit and Monitoring Metrics
- Audit Trail Completeness
- Percentage of IT assets under continuous security monitoring.
- Number of alerts generated by Security Information and Event Management (SIEM) systems.
- Rates of false positive and false negative security alerts. - Legal and Ethical Compliance Metrics
- Regulatory updates tracking and Implementation
- Number of legal and non-compliance incidents
- Number of ethical violations incidents
Scalability
Scalability refers to a system’s ability to handle increasing workloads or to expand in capacity without compromising performance or efficiency. It involves the capability to grow and manage more demands, such as higher user loads or larger data volumes, through horizontal or vertical scaling. Scalability is crucial for ensuring that a system remains responsive and effective as it grows, supporting business expansion and changing demands.
Horizontal Scaling: Adding more machines or resources to distribute the load (e.g., adding more servers).
Vertical Scaling: increasing the capacity of existing resources (e.g., adding more CPU or memory to a server).
Key Focused Areas
- Performance Optimization: Ensuring the system's efficiency as load increases by optimizing code, queries, and algorithms.
- Load Balancing: Distributing traffic across multiple servers to prevent overload and ensure high availability.
- Caching: Using caching mechanisms to reduce the load on downstream systems (databases, APIs) and improve response times.
- Monitoring and Analytics: Continuously monitor system performance and load to identify bottlenecks and optimize resources.
- Network Scalability: Ensuring network capacity and architecture can support increased traffic and data flow.
- Infrastructure as Code: Automating infrastructure provisioning to support dynamic scaling.
Key Metrics
- Response Time: Measures how quickly the system responds to requests.
- Throughput: Number of transactions or requests processed per unit of time.
- Resource Utilization: CPU, memory, and disk usage across servers.
- Latency: Time taken for data to travel across the network.
- Error Rate: Frequency of errors or failed requests.
- Database Performance: Query execution time and connection pooling statistics.
- Traffic Load: Number of concurrent users or sessions.
- Scaling Events: Frequency and success rate of scaling operations.
- Cost Efficiency: Cost per transaction or request as the system scales.
- System Availability: Uptime and reliability during peak loads.
Tracking these metrics helps ensure that a system scales effectively while maintaining performance and stability.
High Availability
High Availability (HA) refers to a system’s ability to remain operational and accessible with minimal downtime, even during failures or maintenance. It ensures continuous service by using redundancy, failover mechanisms, and load balancing. HA is critical for mission-critical applications, where interruptions can have significant consequences.
Key Focused Areas
- Redundancy: Implementing backup components and systems to ensure continuity in case of failures.
- Failover Mechanisms: Setting up automatic failover processes to switch to standby systems during outages.
- Load Balancing: Distributing traffic evenly across servers to prevent overload and ensure consistent performance.
- Monitoring and Alerts: Continuously monitoring system health and setting up alerts for quick response to issues.
- Disaster Recovery: Developing and testing disaster recovery plans to restore services after major incidents.
- Data Replication: Keeping data copies synchronized across multiple locations to prevent data loss.
- Network Reliability: Ensuring network infrastructure is robust and has multiple paths for data transmission.
Key Metrics
- Uptime Percentage: Measures the total time the system is operational.
- Mean Time Between Failures (MTBF): Average time between system failures.
- Mean Time to Recovery (MTTR): Average time taken to recover from failures.
- Failover Time: Time taken for systems to switch over during failures.
- Service Level Agreement (SLA) Compliance: Adherence to uptime and performance commitments.
- Error Rate: Frequency of errors or service disruptions.
- System Load: Monitoring resource usage during peak and off-peak times.
- Network Latency: Time delays in network communications.
- Backup and Recovery Success Rate: Frequency of successful data backups and restorations.
- Incident Frequency: Number of incidents affecting availability over a period.
Reliability
Reliability refers to the ability of a system or component to consistently perform its intended function without failure over a specified period. It involves ensuring that the system operates correctly and dependably, providing accurate results, and maintaining functionality under expected conditions. High reliability minimizes downtime and errors, contributing to user trust and system integrity.
Key Focused Areas
- System Design: Building robust architectures that handle faults and errors gracefully.
- Redundancy: Implementing backup systems and components to prevent single points of failure.
- Testing and Validation: Conduct thorough testing, including stress and load tests, to ensure system resilience.
- Monitoring and Maintenance: Continuously monitor system performance and conduct regular maintenance to prevent issues.
- Error Handling: Designing effective error detection and recovery mechanisms.
- Documentation: Keeping comprehensive documentation for troubleshooting and maintenance.
- User Training: ensuring users are trained to handle common issues effectively.
Key Metrics
- Mean Time Between Failures (MTBF): Average time between system failures.
- Mean Time to Repair (MTTR): Average time taken to repair and restore the system after a failure.
- Failure Rate: Frequency of system failures over a specific period.
- Uptime Percentage: The proportion of time the system is operational and available.
- Error Rate: Number of errors encountered during operation.
- Service Level Agreement (SLA) Compliance: Adherence to agreed-upon reliability metrics.
- System Downtime: Total time the system is unavailable.
- Incident Frequency: Number of incidents affecting system reliability.
Performance
Performance refers to how well a system, application, or component accomplishes its intended function within given constraints. It encompasses various aspects such as speed, efficiency, throughput, responsiveness, and resource utilization. In computing and technology contexts, performance is typically measured and optimized to ensure optimal user experience, operational efficiency, and scalability.
Key Focused Areas
- Response Time: optimizing the time taken to respond to user requests or actions.
- Throughput: maximizing the number of transactions or operations processed per unit of time.
- Scalability: ensuring the system can handle increasing loads by scaling resources horizontally or vertically.
- Resource Utilization: Efficiently using CPU, memory, disk, and network resources to avoid bottlenecks.
- Caching: Utilizing caching mechanisms to store and retrieve frequently accessed data quickly.
- Database Performance: Optimizing database queries, indexing, and schema design for faster data retrieval and updates.
- Code Efficiency: Writing efficient algorithms and code to minimize computational overhead and improve execution speed.
- Network Optimization: Reducing latency and optimizing data transmission across networks.
- Load Balancing: Distributing incoming traffic evenly across servers to prevent overload and ensure consistent performance.
- Monitoring and Tuning: Continuously monitoring system performance metrics and tuning configurations to optimize performance over time.
Key Metrics
- Response Time: Measures the time taken to respond to user requests or system events. It includes:
- Average Response Time: Overall average response time across all requests.
- Percentile Response Time: 90th or 95th percentile response time to understand performance under peak loads. - Throughput: Measures the rate at which the system processes transactions or requests. Key metrics include:
- Requests per Second (RPS): Number of requests processed per second.
- Transactions per Second (TPS): Number of transactions completed per second. - Error Rate: Tracks the frequency of errors or failed transactions. Metrics include:
- Error Rate Percentage: Percentage of requests or transactions that result in errors. - Concurrency: Measures the number of simultaneous users or connections the system can handle without degradation. Metrics include:
- Active Users: Number of users actively interacting with the system at a given time.
- Active Connections: Number of concurrent connections to servers or databases. - Resource Utilization: Monitors the utilization of system resources (CPU, memory, disk, network). Metrics include:
- CPU Utilization: Percentage of CPU used by the system or specific processes.
- Memory Utilization: Amount of memory used by applications or services.
- Disk I/O: Input/output operations per second (IOPS) on disk storage.
- Network Bandwidth: Amount of data transferred over the network per unit of time. - Latency: measures the delay between a request and its response. Metrics include:
- Round-Trip Latency: Time is taken for a request to travel to the server and back to the client. - Cache Hit Rate: Measures the effectiveness of caching mechanisms in reducing data retrieval times. Metrics include:
- Cache Hit Percentage: Percentage of requests served from cache rather than fetching from the database or storage. - Cache Miss Rate: Measures the cache miss rate while retrieving the data. Metrics include:
- Cache Miss Percentage: Percentage of requests directly fetched from database or storage instead of serving from the cache. - Database Performance Metrics: Tracks database-specific metrics such as:
- Query Execution Time: Time taken for database queries to execute.
- Transaction Commit Time: Time taken to commit transactions to the database.
- Database Locks: Number of locks held or contention for resources. - Load Balancer Metrics: Monitors load balancer performance and the distribution of traffic across servers. Metrics include:
- Server Load Distribution: Distribution of requests across backend servers.
- Health Check Status: Status of servers based on health checks performed by the load balancer. - Application Specific Metrics: You might have your application specific metrics that for your application machine critical functionality.
Observability
Observability refers to the capability of understanding and monitoring the internal state of a system based on its external outputs or behaviors. It emphasizes the ability to gain insights into how a system operates, detects and troubleshoots problems effectively, especially in complex distributed architectures.
Key Focused Areas
- Instrumentation
- Logging: Designing logging mechanisms to capture relevant events, errors, and activities within the application.
- Metrics: Defining and collecting metrics that measure the performance, health, and usage of different components.
- Tracing: Implementing distributed tracing to monitor and visualize the flow of requests across microservices or components. - Monitoring and Alerting
- Monitoring Infrastructure: Setting up tools and platforms to collect, store, and analyze logs, metrics, and traces.
- Alerting Rules: Establishing alerting rules based on thresholds or conditions to notify about performance degradation, errors, or anomalies. - Service-Level Objectives (SLOs)
- Defining SLOs: Establishing clear service-level objectives that define acceptable performance and reliability criteria.
- Monitoring SLOs: Implementing monitoring to track SLO compliance and identify areas needing improvement. - Error Handling and Recovery
- Error Reporting: Ensuring comprehensive error reporting with context to facilitate troubleshooting and debugging.
- Fault Tolerance: Implementing mechanisms such as retries, circuit breakers, and fallbacks to handle and recover from errors gracefully. - Performance Optimization
- Performance Metrics: Collecting and analyzing metrics related to response times, throughput, and resource utilization.
- Performance Testing: Conducting performance testing to identify bottlenecks and optimize system performance. - Deployment and Release Management
- Deployment Visibility: Ensuring visibility into application behavior during deployment and release phases.
- Rollback Strategies: Implementing strategies to rollback changes quickly in case of performance or reliability issues. - Security Monitoring
- Auditing and Compliance: Monitoring application activities to ensure compliance with security policies and regulations.
- Security Incident Response: Establishing processes and tools for detecting and responding to security incidents. - User Experience Monitoring
- Real User Monitoring (RUM): Collecting metrics on user interactions and experiences to understand application usability and performance from the user’s perspective.
- Feedback Loops: Incorporating feedback mechanisms to capture user-reported issues and improve application reliability and usability. - Continuous Improvement
- Feedback and Iteration: Using observability data to iterate on application design, performance optimizations, and reliability enhancements.
- Post-Mortem Analysis: Conducting post-incident reviews to learn from failures and improve system resilience.
Key Metrics
- Logging Metrics
- Log Volume: Amount of log data generated over time.
- Log Levels: Distribution of logs by severity (e.g., debug, info, warning, error).
- Log Retention: Duration for which logs are retained and accessible. - Metrics Metrics
- Metric Types: Different types of metrics captured (e.g., counters, gauges, histograms).
- Metric Collection Rate: Frequency of metric collection.
- Metric Cardinality: Number of unique metric series being collected. - Tracing Metrics
- Trace Span Duration: Duration of individual traces or spans.
- Trace Error Rate: Percentage of traces containing errors.
- Distributed Context Propagation: Metrics related to how distributed context (e.g., trace IDs, span IDs) is propagated across services. - Alerting Metrics
- Alerting Rules: Number of defined alerting rules.
- Alert Trigger Rate: Frequency of alerts triggered.
- Alert Resolution Time: Time taken to resolve alerts. - System Performance Metrics
- Response Time: Average and percentile response times for requests.
- Error Rate: Percentage of requests resulting in errors.
- Resource Utilization: Metrics related to CPU, memory, disk, and network usage. - Service-Level Objectives (SLOs) Metrics
- SLO Compliance: Percentage of time SLOs are met.
- SLO Violation Duration: Duration and frequency of SLO violations. - User Experience Metrics:
- Page Load Time: Time taken for web pages or applications to load.
- Transaction Success Rate: Percentage of successful transactions or operations. - Data Pipeline Metrics
- Data Flow Rate: Rate of data ingested or processed by pipelines.
- Pipeline Latency: Time taken for data to move through pipelines. - Infrastructure Metrics
- Server Availability: Percentage of time servers are available.
- Network Latency: Round-trip time for network requests. - Security Metrics
- Security Events: Number of security-related events or incidents.
- Security Policy Violations: Instances of violations against security policies.
User Activity Tracking
User activity tracking in enterprise applications involves monitoring and logging user interactions, actions, and behaviors within the application. This process is essential for various purposes, including security auditing, compliance, user behavior analysis, and system optimization.
Considerations for Implementing User Activity Tracking
- Scalability: Design tracking mechanisms that can handle large volumes of data without impacting application performance.
- Integration: Integrate tracking functionalities seamlessly into existing application workflows and infrastructure.
- Data Retention and Purging: Define policies for data retention and purging to manage storage and compliance requirements effectively.
- Authentication and Access Control: Ensure that only authorized personnel have access to view and manage user activity logs.
Key Foused Areas
- Logging Events and Actions
- Authentication and Authorization: Log user login/logout events, access attempts, and permission changes.
- Data Access: Track data read, write, and modification operations performed by users.
- Application Usage: Monitor feature usage, navigation patterns, and workflow interactions. - Data Collection and Storage
- Data Granularity: Capture detailed information about each user action, including timestamps, IP addresses, and session identifiers.
- Sensitive Data Handling: Ensure compliance with data protection regulations by anonymizing or encrypting sensitive user information in logs. - Monitoring and Analysis
- Real-time Monitoring: Implement mechanisms to monitor user activity in real-time to detect suspicious behavior or security incidents promptly.
- Analytics and Reporting: Use collected data for trend analysis, performance optimization, and user behavior insights. - Compliance and Auditing
- Regulatory Compliance: Ensure tracking mechanisms align with industry standards and legal requirements (e.g., GDPR, HIPAA).
- Audit Trails: Maintain audit trails of user activities to facilitate compliance audits and investigations. - Security and Incident Response
- Anomaly Detection: Use user activity logs to detect unusual or unauthorized activities that may indicate security breaches.
- Incident Response: Leverage tracked data to investigate incidents, identify root causes, and mitigate risks promptly. - User Privacy and Transparency
- Privacy Policies: Clearly communicate to users the types of data being tracked, how it is used, and their rights regarding data privacy.
- Opt-in/Opt-out: Provide mechanisms for users to opt-in or opt-out of certain tracking activities where applicable.
Key Metrics
- Login and Authentication Metrics
- Login Success Rate: Percentage of successful user login attempts.
- Login Failure Rate: Percentage of unsuccessful user login attempts.
- Unique Users: Number of unique users accessing the application over a period. - Session Management Metrics
- Session Duration: Average duration of user sessions.
- Active Sessions: Number of active user sessions at any given time.
- Session Timeout Rate: Percentage of sessions that expire due to inactivity. - Feature Usage Metrics
- Most Used Features: Identification of the most frequently accessed application features.
- Feature Adoption Rate: Rate at which new features are adopted by users.
- Feature Abandonment Rate: Percentage of users who start using a feature but do not complete the intended actions. - Navigation and Interaction Metrics
- Page Views: Number of times each page or screen within the application is viewed.
- Click-through Rate (CTR): Percentage of users who click on specific elements (e.g., buttons, links).
- Path Analysis: Analysis of user navigation paths through the application. - Performance Metrics
- Response Time: Average time taken for the application to respond to user actions.
- Latency: Time delay between user action and application response.
- Error Rates: Frequency of errors encountered during user interactions. - Conversion Metrics
- Conversion Rate: Percentage of users who complete desired actions (e.g., sign up, purchase).
- Abandonment Rate: Percentage of users who start but do not complete conversion actions. - Security and Compliance Metrics
- Access Control Violations: Instances where users attempt unauthorized access.
- Compliance Audit Logs: Logs tracking activities related to regulatory compliance requirements (e.g., data access audits). - User Engagement Metrics
- Active Users: Number of users actively interacting with the application over a period.
- Retention Rate: Percentage of users who return to the application after their initial visit.
- Churn Rate: Percentage of users who stop using the application over a specific timeframe. - Feedback and Sentiment Metrics
- User Feedback: Collection and analysis of user feedback and sentiment through surveys, reviews, or feedback forms.
- Net Promoter Score (NPS): Metric indicating user satisfaction and likelihood to recommend the application to others.
Auditing
Auditing involves ensuring that the application maintains comprehensive audit trails and supports auditing capabilities to meet regulatory compliance, security monitoring, and operational transparency.
- Audit Trail Generation: Ensuring the application generates detailed logs of all relevant actions and events. This includes user interactions, system activities, data access, configuration changes, and security-related events.
- Data Integrity: Verifying that audit logs are tamper-evident and secure, ensuring the integrity of recorded actions and preventing unauthorized modifications.
- Compliance Requirements: Addressing specific regulatory and industry compliance standards (e.g., GDPR, HIPAA, PCI-DSS, SOX) that mandate auditing practices and data protection measures.
- Access Control Auditing: Monitoring and logging access attempts, authentication events, and authorization changes to detect and respond to unauthorized access or misuse.
- Configuration Auditing: Tracking changes to application configurations, system settings, and security policies to maintain consistency, compliance, and security posture.
- Incident Response and Forensics: Supporting incident investigation and forensic analysis by providing audit trails that enable reconstruction of events leading up to security incidents or operational failures.
- Retention and Storage: Defining policies and procedures for audit log retention, ensuring logs are securely stored, accessible for auditing purposes, and retained for required durations as per regulatory and business requirements.
- Monitoring and Alerting: Implementing real-time monitoring of audit logs to detect anomalies, suspicious activities, or deviations from expected patterns. Alerts should notify relevant stakeholders promptly for timely response and mitigation.
- Reporting and Analysis: Enabling auditing teams to analyze audit data, generate reports, and conduct audits to ensure adherence to policies, identify areas of improvement, and demonstrate compliance during audits.
Key Metrics
- Audit Log Coverage: Percentage of critical actions and events that are logged within the application or system.
- Audit Log Integrity: Measures ensuring that audit logs are tamper-evident and maintain data integrity.
- Audit Log Retention Period: Duration for which audit logs are retained and accessible for auditing and compliance purposes.
- Audit Log Access: Number of authorized accesses to audit logs over a specified period.
- Audit Log Review Frequency: Frequency and regularity of audit log reviews conducted by auditors or security teams.
- Compliance Violations: Number of instances where audit logs indicate non-compliance with regulatory or organizational policies.
- Incident Response Time: Average time taken to respond to and investigate incidents based on audit log findings.
Usability
Usability focuses on ensuring that the application is intuitive, easy to use, and meets the needs of its users efficiently.
Considerations for Implementing Usability NFR:
- User-Centered Design: Prioritize user needs and preferences throughout the design and development process.
- Feedback Loops: Establish mechanisms for gathering and incorporating user feedback into iterative design improvements.
- Cross-functional Collaboration: Involve stakeholders from UX/UI design, development, and business teams to ensure usability goals align with business objectives.
- Continuous Improvement: Adopt a mindset of continuous improvement to evolve the application’s usability based on changing user needs and technological advancements.
Key Focused Areas
- User Interface (UI) Design
- Intuitiveness: The application should be easy to navigate and use, with logical and consistent layouts.
- Accessibility: Ensure the application is accessible to users with disabilities, following accessibility standards (e.g., WCAG guidelines). - User Experience (UX)
- Efficiency: Users should be able to accomplish tasks quickly and with minimal effort.
- Satisfaction: Focus on user satisfaction through pleasant interactions and responsive design. - Navigation and Information Architecture
- Clear Navigation: Provide clear menus, breadcrumbs, and navigation paths to help users find information easily.
- Information Hierarchy: Organize content and features logically, prioritizing important information for quick access. - Consistency and Standards
- UI/UX Guidelines: Adhere to established design patterns, standards, and style guides to maintain consistency across the application.
- Platform Consistency: Ensure consistency in design and behavior across different devices and platforms (e.g., desktop, mobile). - Feedback and Error Handling
- Feedback Mechanisms: Provide immediate feedback for user actions (e.g., success messages, validation errors).
- Error Prevention: Design interfaces to prevent user errors through clear instructions and validations. - Performance Impact
- Responsiveness: Ensure the application responds promptly to user interactions without delays.
- Load Time: Optimize loading times for pages and data to enhance user experience. - User Preferences and Customization
- Personalization: Allow users to customize settings, layouts, and preferences to tailor their experience.
- Localization: Support multiple languages and regional preferences to accommodate diverse user bases. - Usability Testing and Iteration
- User Testing: Conduct usability testing with representative users to identify pain points and areas for improvement.
- Iterative Design: Continuously iterate on the application design based on user feedback and usability testing results.
Key Metrics
- Task Completion Rate: Percentage of tasks that users can complete successfully without assistance.
- Time on Task: Average time taken by users to complete specific tasks, reflecting efficiency.
- Error Rate: Number of errors made by users during interactions, indicating interface clarity and intuitiveness.
- User Satisfaction: User satisfaction scores collected through surveys or feedback, measuring overall experience.
- Navigation Efficiency: Number of clicks or steps required to complete tasks, indicating ease of navigation.
- Retention Rate: Percentage of users who continue using the application over time, reflecting long-term usability.
- Bounce Rate: Percentage of users who leave the application after viewing only one page, suggesting navigation or content issues.
- Onboarding Time: Time required for new users to become proficient in using the application, indicating ease of learning.
- Feedback and Iteration Cycle Time: Time taken to implement usability improvements based on user feedback and testing.
That’s all for today!
Thank you for taking the time to read this article. I hope you have enjoyed it. If you enjoyed it and would like to stay updated on various technology topics, please consider subscribing for more insightful content.